
List the ten to thirteen attributes your core customer cares about. Score yourself and your two to four closest competitors out of five on each, then plot the gap. You walk out with a one-page picture of where you’re a clone, where you can win, and where the white space sits.
Attribution map: definition
A one-page scoring grid that ranks your business and your two to four closest competitors out of five on the willingness-to-pay drivers (the attributes your core customer actually weighs when deciding to hire). Rooted in Michael Porter’s strategic positioning work, taught at Wharton Business School and Harvard Business School strategy programmes.
I’ve used every strategy framework you’ve heard of. Five Forces, SWOT, Blue Ocean, Balanced Scorecard. Most went in the bin. This one stayed. I learned it on a Wharton Business School strategy course covering Michael Porter’s strategic positioning. The course taught the tool as scoring your willingness-to-pay drivers against your competitors. That’s still the version I run with clients today.
When I ran Rackspace UK we knew exactly which niche we wanted to own. Linux hosting, then Microsoft hosting, for customers with real budget who cared about service. We said no to telephony, no to connectivity, no to professional services. Inch wide, mile deep. We took it from a standing start in 2001 to 150 people and £26m. At Peer 1 Hosting we picked one attribute we believed we could own and decided we’d be the number one hoster of Magento Enterprise in the UK and North America. Two years later, we were. The UK business went from a standing start to £30m in five years.
Both decisions came out of the same exercise: an attribution map. It’s the only strategy tool I still pull out with every founder-CEO I coach at the £5m:£40m stage, because it does the one thing the other frameworks dodge. It forces the exec team to be brutally honest about where they’re identical to their competitors, and where they aren’t.

What is an attribution map?
An attribution map is a one-page scoring grid that ranks your business and your two to four closest competitors against ten to thirteen attributes your core customer uses to decide who to buy from. (Ten is a guide; up to thirteen is fine if each attribute is genuinely distinct.) The point isn’t the chart. The point is what the chart forces you to admit.
Strictly, it isn’t a strategy tool. It’s a cloning detector. Its only useful job is to prove your strategy isn’t one yet.
Porter named the principle. Wharton taught me the tool. Susko packaged it for scale-ups.
- Michael Porter, “What Is Strategy?” (HBR, 1996). The foundational claim: strategy is “the creation of a unique and valuable position involving a different set of interdependent activities”. Compete to be unique, not to be the best.
- Wharton Business School teaches Porter’s framework via a 1-to-5 scoring grid of willingness-to-pay drivers for your firm and two or three competitors. The grid surfaces strategic positioning on a WTP-versus-cost map. That’s the artefact you actually walk out with.
- Shannon Susko‘s 3HAG system uses the same tool, relabels it as the attribution framework, and bolts on the facilitation discipline that makes it work inside scale-up exec teams. Susko didn’t invent the tool. She packaged it brilliantly.
Get the map right and the rest follows. Get it wrong, or skip it, and you end up with a strategy that is just slogans.
Where this fits: the bridge to your OPSP
The attribution map is the diagnostic that fills Column 3 of your one-page strategic plan (OPSP). Your four 5s become Key Thrusts. Your 1 becomes the explicit non-investment. It turns “we want to grow to £40m” into “here are the four attributes we’ll be world-class at by 2029, and here’s the one we’ll deliberately suck at.” Without that, Column 3 is wishful thinking.
Most of my client work with founder-CEOs at this scale centres on filling in that plan. The third column carries Key Thrusts and Capabilities: the three-to-five-year priorities that turn fiscal targets into operational reality. That column is where you stall. You’ve got a number for revenue in 2029, usually a doubling. You can’t tell me the four things you’ll be world-class at by then. When I ask, I always hear the same three fallbacks: customer service, innovation, our people. None of them are strategic positions. They’re things every competitor also says.
Why are most “strategies” actually guesswork?
I sit down with a new client and ask them to walk me through their strategy. Nine times out of ten, what they describe is a budget plus an ambition. There’s no view of why a customer would pick them over the next firm.
So I ask: why do customers buy from you? Pause. Then a thin answer. Then I ask: is that also true of your three biggest competitors? Yes. Almost always yes. That isn’t a strategy. That’s convergence.
Michael Porter’s definition is the one I keep coming back to: strategy is “the creation of a unique and valuable position involving a different set of activities”. The keywords are unique and different. Without a clear view of where you’re different, the only lever you have left is price. Cutting price to win deals isn’t a strategy. It’s the absence of one.
Especially now. McKinsey’s 2025 B2B pricing analysis calls this out directly: AI is flattening every technical differentiator B2B teams used to lean on, and the firms holding margin are the ones that already chose a strategic position to defend. If your 5/5 attribute is something a competitor can buy off-the-shelf next quarter, you’re already in trouble.
The test: if your three biggest competitors could swap their logo onto your pitch deck and nothing would jar, you don’t have a strategy. You have a budget with adjectives.
How do you build an attribution map?
You can run the first version of this with your exec team in an afternoon. Block four hours, kill phones, get a whiteboard. Eight steps.
Before you start: pin your core customer. Know your competitors well enough to score them. If you can’t write your core customer in 50 words or fewer (who they are, the painful problem they have, how you solve it), stop. You don’t have a core customer yet, you have a list of accounts. If you can’t honestly score your closest two to four competitors on every attribute, pause and do the research. Mystery-shop them, talk to lost-deal customers, read their proposals. Garbage in, garbage out.
- Split into pairs or trios. Don’t brainstorm as a single group of eight. The loudest voice will dominate. Two-person and three-person sub-groups force everyone to put a stake in the ground.
- Brainstorm the attributes. Get into the shoes of your core customer. What attributes do they actually weigh when deciding to hire? Price will be one. Get every plausible one on the board, including the attributes where competitors excel. If you only list attributes you’re proud of, you’ll end up with a self-portrait, not a market view.
- Consolidate to ten. Ten is a guide; up to thirteen is fine if each is genuinely distinct. Combine the sub-groups’ lists. Cut anything technically true but irrelevant to the buying decision. Cut anything that’s really just a sub-flavour of another attribute. The list you keep is the list your customer cares about, not the list your team is proud of.
- Score yourself one to five. Brutally honestly. If everything’s a four or a five, you’re not being honest enough. Rank in order from highest to lowest. You can’t be brilliant at everything.
- Score your two to four closest competitors one to five. This is where most exec teams discover they’re guessing. If you genuinely can’t score a competitor on an attribute, park it, do the homework, come back. Same scoring discipline as your own column.
- Plot the graph. Order the attributes from your highest to your lowest. Plot all the lines on top. Your line will slope downward by design. So will theirs.
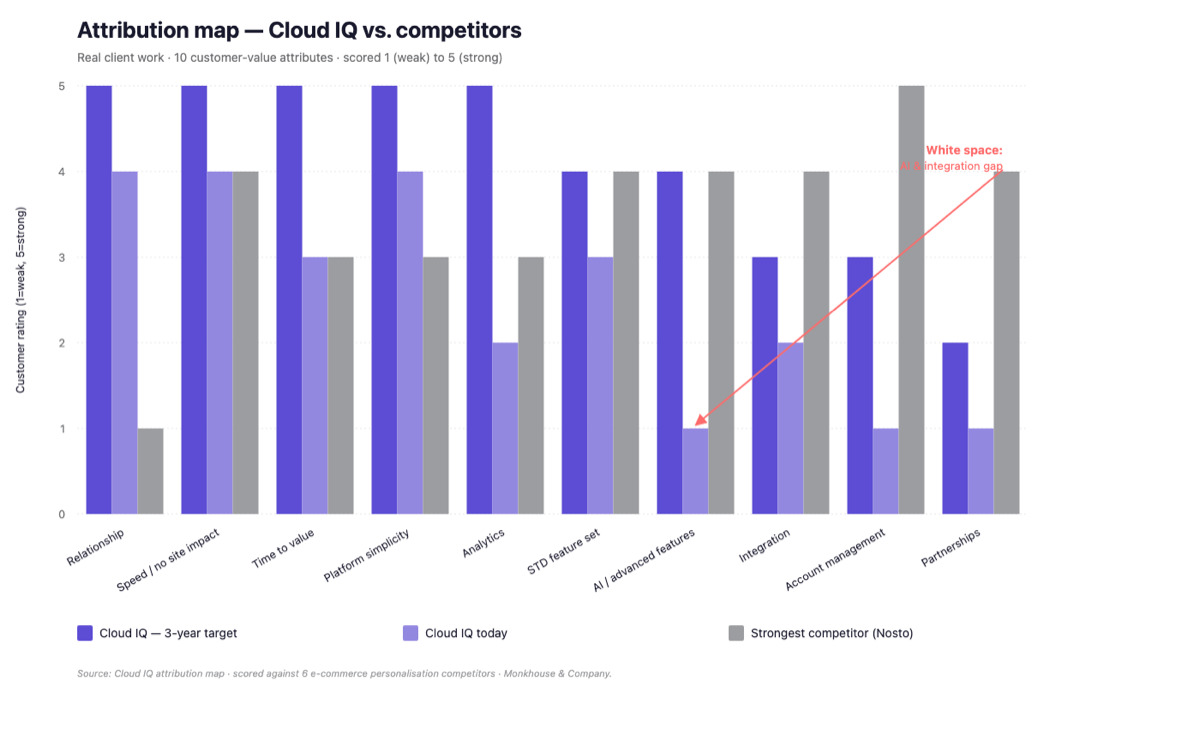
- Identify the white space. An attribute passes the white-space test only if all three are true: (a) no competitor is at four or five on it, (b) your core customer would value excellence on it, (c) you can realistically move there and defend it. If multiple attributes pass, pick the one most strategically central. If none pass, the comparator set or the attribute list is wrong. Go back.
- Draw your three-year line. Pick four 5s and at least one 1. Decide where you want to be in three years. Pick up to four attributes you’ll commit to mastering as 5s. The white-space attribute should be one of them. AND pick at least one 1: a deliberate non-investment, the thing you’ll refer away to a competitor better suited to deliver it. Without a 1, the framework is incomplete. Your four 5s are claims; the 1 is what makes them defensible.
Build your own attribution map
Want to run this with your exec team without me in the room? The Attribution Framework Field Guide walks you through the same eight steps with worked examples. No coach required.
One UK IT managed-services client I was working with got to step five and stalled. Their exec team had no honest intelligence on how their five biggest competitors went to market. They hired a third party to mystery-shop all five, request proposals, and come back two weeks later with the actual pricing structures, scoping questions and pre-sale experience their rivals were running. Then we finished the map. They walked out with a real view of how those five rivals scoped, sized and priced, and stopped discounting on deals where they were already holding the strongest attribute.
Worked example: Peer 1 Hosting
When I was running Peer 1 in the UK, our attribution map showed us we were one of three or four serious managed-hosting firms in the UK with no real differentiation visible to a buyer. We picked one attribute the others were ignoring: depth of expertise on Magento Enterprise. We restructured sales, hiring and partner relationships around that single attribute. Within two years we were the number one Magento Enterprise hoster in the UK and North America. The UK business went from a standing start to £30m in five years on the back of that one decision. Globally, Peer 1 went from $90m to $200m in the same period. The map didn’t magically pick the attribute. It made the choice impossible to dodge.
What are the five payoffs of attribution mapping?
1. It tells you where to focus
An attribution map separates why customers actually buy from what your team likes talking about. One of the dozen attributes is price. The other eleven aren’t. Working out which of those eleven you’re good at, which you aren’t, and which the customer actually weights is the highest-value hour you’ll spend this quarter.
It also gives you a list of things to say no to. At Rackspace we ran on a default no. Telephony? No. Connectivity? No. Professional services? No. The map gave us the discipline to mean it. Without one, you say yes too often, then wonder why your team is exhausted and the strategy keeps drifting.
2. It forces you to pick a 1
The five payoffs aren’t really five. They’re four 5s and a 1. The four 5s are the attributes you commit to mastering: your white-space attribute and three more. The 1 is the attribute you commit to not investing in. Not a three. Not a four. A one. Something you’ll deliberately refer away to a competitor better suited to deliver it.
Skipping this part is the move I see most. You’ll happily pick the four 5s. You won’t pick the 1, because picking a 1 means saying no to revenue. Out loud. To your team and your sales pipeline. But the 1 is the binding constraint that frees the system (Goldratt’s Theory of Constraints, applied to positioning rather than throughput). Without it, your four 5s are claims. The 1 is what makes them defensible. The framework is incomplete without it.
3. It finds the white space
The chart goes up on the wall and someone in the room spots a gap nobody is occupying. That gap is the white space. That’s your potential niche. A position where there’s your proposal and only your proposal, no direct competition, no price pressure. Customers buy at a profit because there’s nothing like-for-like to compare you with.
4. It gives you a three-year road map
Once the map is on the wall, you flip its output into swim lanes. For each of the three to five attributes you’ve decided to own, you write three to five milestones across the next 36 months. That’s the link between strategy and execution that most exec teams skip. Quarterly objectives stop being whatever sales and marketing want to tee up next, and start tying back to the attributes you’re deliberately winning.
If you haven’t done one yet, your competitors almost certainly haven’t either. They won’t notice you’re doing it. They won’t be as focused as you. That’s how scale-ups win.
I scaled two companies to £30m. Every week, I'll show you how.


5. It aligns your exec team
I’ve watched exec teams go from polite disagreement to genuine alignment in a single afternoon on this. It isn’t a 40-page strategy report. It’s one chart. Everyone scores it. There’s nowhere to hide.
That’s also where it gets political. Vested interests show up. Someone on your team won’t want to score themselves a two on an attribute they’ve spent five years promoting. Expect “that isn’t valid” or “the data is wrong”. Stay with it. The willingness to have that conflict in the room is the test of whether your exec team is ready for the next stage of growth.
Most teams that run this honestly lose someone within twelve months. Either the senior who couldn’t take a 2/5 in front of the room, or the senior who realised the team was holding them back. That’s the real cost of an attribution map. Not the four hours.
The ultimate test: net margin.
If your net margin is higher than your competitors’, you’re winning. If it isn’t, you’re not, yet. The four 5s and the 1 give you a defensible position. Net margin is what proves it worked. In the long run, margin is the only number that matters.

Where do leadership teams get attribution mapping wrong?
Three failure modes I see most often with scale-up exec teams. Each one is the difference between a quarter spent winning attributes and a quarter spent rearranging the deckchairs.
- They guess about competitors. If you can’t honestly score your two to four closest rivals out of five on every attribute, you don’t have an attribution map yet. You have a self-portrait. Mystery-shop, talk to lost-deal customers, read their proposals, do the homework.
- They wait for the map to be perfect. The first version won’t be. It doesn’t matter. Get a workable version on the wall in an afternoon, then iterate quarterly. A shed in two weeks beats a castle in two years.
- They build the map and never flip it into swim lanes. The map is the diagnosis. Swim lanes are the prescription. Without the prescription, the diagnosis is just an interesting wall poster.
Connected to this: it’s easy to confuse operational effectiveness with strategic positioning. That’s the productivity frontier trap Porter warned about. His 1996 HBR essay “What Is Strategy?” set it out. Harvard Business School’s 2026 AI trends analysis revisits exactly this: the firms compounding advantage are the ones picking trade-offs, not the ones racing to match every feature. If everyone in your sector has copied each other’s products, systems and even staff, you’re converging on the productivity frontier with no differentiated position. The attribution map is the cheapest way to find out whether that’s you.
Common questions about attribution mapping
Who created the attribution framework?
Michael Porter named it. His 1996 HBR essay “What Is Strategy?” is the source. I learned the tool itself on a Wharton Business School course, where it is taught as a willingness-to-pay drivers grid: score your firm and two or three competitors out of five on the attributes that matter to your customer, then plot the result on a WTP-versus-cost positioning map. Shannon Susko later used the same tool in her 3HAG system and called it the attribution framework. Most scale-up CEOs meet it through Susko. The version I work with clients is the Wharton-rooted one, with Susko’s facilitation discipline laid over the top.
How is an attribution map different from a customer journey map?
A customer journey map shows the steps a customer takes from awareness to purchase to retention. An attribution map shows the criteria that customer uses to compare you to your competitors at the buying decision. Different jobs. The journey map helps marketing and customer experience teams design touchpoints. The attribution map helps the exec team make strategic positioning calls about which attributes to own over the next 36 months. The two complement each other but they answer different questions, and you’ll usually need the attribution map first, because it tells you which journey is even worth optimising.
How long does it take to build the first attribution map?
An afternoon for the first usable version with your exec team in a room. Half a day to a day to refine it once you’ve closed gaps in competitor intelligence (which usually means a couple of weeks of mystery shopping or talking to lost-deal customers). Then a quarterly review to update scores as the market moves and as you make progress on the attributes you’ve decided to own. Treat it as a living document, not a one-off offsite output. The exec teams I see fail with this tool are the ones who build it once, frame it on the wall, and never revisit the scoring.
Do you need a coach to facilitate it?
You don’t need one. You probably want one for the first attempt. The hard part isn’t the tool. The hard part is keeping the exec team honest about scoring themselves, particularly on the attributes they’re weakest on. An outside facilitator gives you cover to push back on “that isn’t valid” without it becoming a personal fight inside the leadership team. The CEO almost never gets a clean read of where the team is fooling itself, because the team is reading the CEO’s tells. After the first cycle, most teams can run their own quarterly updates without help.
What is the difference between an attribution map and a SWOT analysis?
SWOT lists strengths, weaknesses, opportunities and threats in four boxes with no scoring and no comparison. An attribution map forces a quantified head-to-head against named competitors on the attributes the customer actually weights. SWOT tells you what you think about yourself. The attribution map tells you what the market sees when it compares you with the alternatives. SWOT can take an afternoon and produce nothing actionable. The attribution map can take an afternoon and produce a three-year plan, because every attribute you decide to own becomes a swim lane with milestones attached. That is the difference between a list and a strategy.
How does the attribution map connect to swim lanes and the 36-month plan?
Once you’ve picked the three to five attributes you’re going to own, each one becomes a swim lane. Write three to five milestones across the next 12 quarters for that attribute. Recruitment, product, service definition, partnerships, all hang off the swim lane for the attribute they support, because delivering an attribute is almost always multi-functional. Annual and quarterly objectives become “where are we against the swim-lane milestones?” rather than “what should we do this quarter?”. That’s what closes the gap between strategy and execution. Read more in how to focus on the right things in your business.
When is the wrong time to build an attribution map?
If you don’t have a core customer yet, the map won’t work. You’ll end up with attributes that are weighted differently for different segments, which produces a fuzzy chart that nobody trusts. Pick the core customer first, then build the map for that one segment. If you serve two genuinely different segments, build two maps. Don’t average them. The other wrong moment is the week before a board meeting when you need a deck. The first version of the map is honest and uncomfortable, and it shouldn’t be done under deck pressure. Block the time properly.
I’ve run this exercise with founder-CEOs of scale-up businesses across more than 100 engagements since 2017, from £5m services firms to £40m product companies, and the same three failure modes show up every time.
What’s next: the Activity Fit Map
Once your map is on the wall and you’ve picked your four 5s and your 1, the next step is the Activity Fit Map. For each attribute you’ve committed to owning, you identify three to five differentiating, interdependent activities: the things you’ll actually do to deliver that attribute. The activities have to interlock. Each one makes the others more powerful. That’s what creates a position competitors can’t copy.
The attribution map gives you the diagnosis. The Activity Fit Map gives you the prescription. The map alone is interesting. The map plus the activities is a strategy.
What should you do next?
An attribution map is useful only if it changes behaviour. The point is not the grid. The point is the trade-off it forces.
Once the white space is visible, the leadership team can stop arguing from opinion and start deciding where to invest, where to match, and where to deliberately lose.
That is the point. Strategy becomes real when the team can name what it will over-invest in and what it will stop pretending to own.
Four ways to take this further
- Book a call. If your strategy still reads like a list of wishes rather than a set of hard trade-offs is now constraining growth, Dominic can help you decide whether the problem is unclear customer attributes, weak differentiation, competitor copying, or leadership-team misalignment. No obligation, no pitch. You will know quickly whether this is the right kind of help.
- Grab the book. Mind Your F**king Business gives founder-CEOs a practical way to stop being the bottleneck and build a company that can scale without them in every room.
- Get clarity on your differentiated strategy. Use this next if the attribution map shows you are competing on too many attributes at once.
- Subscribe to the newsletter. Get a weekly founder-CEO note on strategy, positioning and the operating choices that make scale-up growth less accidental.
Your move. Choose one attribute your customer cares about and score yourself honestly against your two closest competitors. If you cannot prove your score, lower it.
About the author
Dominic Monkhouse scaled Rackspace UK and Peer 1 Hosting as Managing Director, taking both to a £30m annual run rate. He is the founder of Monkhouse & Company.